Gunter vs. Van Alstyne: Comparing Two Fast-Growing Towns
If you are narrowing Grayson County to the next ring of growth towns—not Sherman or Denison, but the smaller cities families keep comparing over Friday-night lights and Sunday house tours—the shortlist often lands on Gunter and Van Alstyne. Both are growing fast. Both sell a version of small-town North Texas with strong school interest and new rooftops. They are not the same bet.
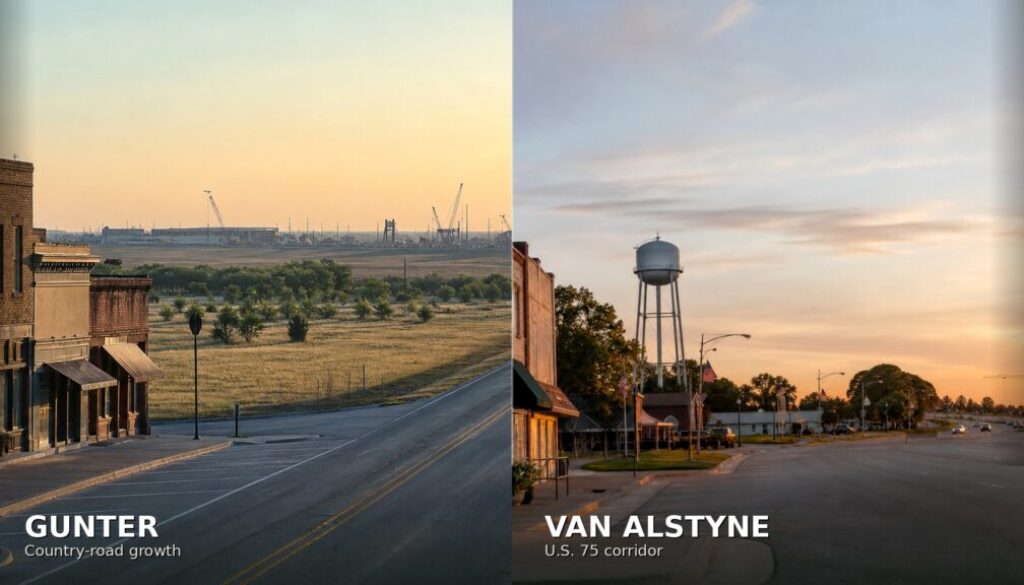
Gunter sits west of the U.S. 75 spine, closer to a country-road / FM-289 pattern and the industrial story that has followed BNSF and surrounding development. Van Alstyne sits on the U.S. 75 corridor between McKinney/Anna and Sherman, with more of a highway-town footprint and a larger absolute population. This guide compares them fairly for newcomers. It is not a vibe contest and it does not invent a winner.
For deeper single-city checklists, start with our Moving to Gunter: Complete Guide and Moving to Van Alstyne: Complete Guide. For live project pressure, keep What’s Coming to Gunter and What’s Coming to Van Alstyne bookmarked. If you are still weighing the larger Texoma hubs, see Sherman vs. Denison: Which Is Right for Your Family?.
Quick snapshot
Population estimates below are from the U.S. Census Bureau Population Estimates Program (Vintage 2025 city totals). Income, housing, age, and tenure figures use Census Reporter’s ACS 2024 5-year estimates for each city. School letters come from Texas Education Agency 2025 accountability materials (released August 2025). ACS numbers are multi-year averages—useful for orientation, not a substitute for today’s listing comps or your own paycheck math.
| Measure | Gunter | Van Alstyne |
|---|---|---|
| Population estimate (July 1, 2025, PEP) | 2,574 | 8,012 |
| Change since 2020 estimates base (PEP) | +24.0% (from 2,076) | +79.6% (from 4,461) |
| ACS 2024 5-year population (survey average) | 2,398 | 5,952 |
| Median household income (ACS 2024 5-year) | $120,000 | $102,469 |
| Median owner-occupied home value (ACS) | $547,600 | $342,700 |
| Median gross rent (ACS) | $1,636 | $1,345 |
| Owner-occupied rate (ACS) | 69.3% | 75.4% |
| Median age (ACS) | 36.1 | 36.4 |
| Poverty rate (ACS) | 2.5% | 7.0% |
| Public school district headline (TEA 2025) | Gunter ISD — overall B (86) | Van Alstyne ISD — overall A (90) |
| Mean travel time to work, school-district geography (ACS / Census Reporter) | Gunter ISD ~34.6 minutes | Van Alstyne ISD ~29.6 minutes |
In one line: Van Alstyne is the larger, faster-growing U.S. 75 town with a lower ACS median home value and an A-rated district headline in the 2025 TEA release. Gunter is smaller and quieter on absolute scale, posts a higher ACS household income and home-value median, and carries a B (86) district headline with A-rated high school and elementary campuses in the same release.
Housing and cost of living
Census baselines are the honest starting point—not what a Facebook comment claims “everything costs.”
- Gunter (ACS 2024 5-year): median owner-occupied value $547,600; median gross rent $1,636; owner-occupied rate 69.3% (489 of 706 occupied units).
- Van Alstyne (ACS 2024 5-year): median owner-occupied value $342,700; median gross rent $1,345; owner-occupied rate 75.4% (1,614 of 2,141 occupied units).
Two caveats matter for families:
- ACS medians lag the market. Asking prices, builder incentives, and days-on-market move with interest rates and how many Collin County reverse-commuters actually relocate versus drive. Pull recent comps street-by-street.
- Neighborhood > city average. Gunter’s established blocks near the square feel different from fringe acreage and new subdivisions tied to industrial growth. Van Alstyne’s older core differs from U.S. 75-adjacent production housing. Floodplain, HOA rules, and school attendance zones matter more than the citywide median.
Permit volume underscores the different paces of supply. Census Building Permits Survey summaries compiled for city profiles show Van Alstyne authorizing on the order of 376 residential units in 2024 versus roughly 34 in Gunter—consistent with Van Alstyne’s much larger absolute growth. Treat those as housing-supply context, not a guarantee that inventory will feel “easy” when you shop.
Poverty rates in the ACS window are about 2.5% in Gunter and 7.0% in Van Alstyne. Those are community context, not a judgment on either town—both have strong blocks and stressed blocks, as every Texoma city does.
Schools: Gunter ISD vs. Van Alstyne ISD
Most in-city addresses feed the local district, but attendance lines do not always match city limits. Confirm your zone before you lease or close.
Gunter ISD
Texas Education Agency 2025 accountability materials for Gunter ISD (091917) show an overall B rating with score 86. Campus student-achievement calculation rows in the same release list Gunter High School as an A (90), Gunter Middle as a B (80), and Gunter Elementary as an A (90). Local coverage has also highlighted the high school’s A. Start at gunterisd.org and verify the current district and campus letters on TXschools.gov.
Van Alstyne ISD
TEA 2025 materials for Van Alstyne ISD (091908) show an overall A rating with score 90. Campus rows in the student-achievement calculation list Van Alstyne High School as an A (96), Van Alstyne Junior High as an A (91), and Van Alstyne Middle as a B (86). Regional roundups sometimes group districts loosely—treat the TEA report and TXschools.gov as the source of truth for the year you care about. Start at vanisd.org (confirm the district’s current site) and TXschools.gov.
Practical family moves for either city:
- Confirm attendance zone and transportation before you sign.
- Compare campus report cards for your kids’ grade bands—district headlines hide campus variation.
- Ask about capacity, bond projects, and special programs if your street is in a growth pocket. Fast enrollment growth is part of why these two towns are on your list.
- Private and charter options exist in wider Texoma—verify accreditation and seats yourself.
Jobs, commute, and daily life
Scale and character
- Gunter: Smaller absolute footprint, high ACS incomes and home values, and a country-road feel west of the interstate spine. Growth is real (+24% in the PEP 2020–2025 window), but the town still reads quieter than a U.S. 75 boomtown. Industrial and logistics projects in and around Gunter—including the long BNSF story—are part of the local conversation; follow the Gunter development tracker rather than rumor chains.
- Van Alstyne: Larger population, much faster absolute growth (+79.6% PEP 2020–2025), and a clearer U.S. 75 identity between Collin County and Sherman. More new-home volume shows up in permit tallies. Everyday retail and services are expanding with the rooftops; still map your grocery, clinic, and childcare loop before you assume “small town” means short errands. See the Van Alstyne development tracker.
Getting around
Both towns feed Dallas–Fort Worth labor markets, but the drive feels different. Van Alstyne puts you on the U.S. 75 corridor—useful for Anna, Melissa, McKinney, and Plano-bound workers who already know that highway’s rhythms. Gunter leans on state and farm-to-market routes (including the FM 289 / State Highway 289 pattern many locals use) and sits farther from the interstate “conveyor.”
Census Reporter ACS figures for school-district geography put mean travel time to work near 34.6 minutes in Gunter ISD and 29.6 minutes in Van Alstyne ISD. Those are averages across all workers—your Collin County reverse commute or fab-shift drive will not match the ACS number. Drive your prospective route at 7 a.m. and 5 p.m. before you bid.
Weekends and water
Neither town is a Lake Texoma waterfront city the way Pottsboro or parts of Denison can feel, but Gunter’s western/northern Grayson position often means a shorter jump toward lake recreation for many households, while Van Alstyne’s weekend gravity often runs south toward Collin County amenities and north toward Sherman–Denison. Map the parks, ballfields, and Friday-night stadium you will actually use—not a brochure map.
Who each town tends to fit
- Lean Gunter if you want a smaller absolute town, are comfortable with country-road commuting patterns, care about Gunter ISD’s campus mix (including A-rated high school and elementary rows in the 2025 TEA materials), and can underwrite ACS-level home values that run higher than Van Alstyne’s citywide median.
- Lean Van Alstyne if you want U.S. 75 access, a larger and faster-growing peer group, a lower ACS median home value (still verify street-level comps), and a 2025 TEA district headline of A (90) with a very strong high-school row.
- Tour both if schools and commute are your top two filters. Sit in dismissal traffic, walk the grocery you would actually use, and open the development trackers the same week you write an offer.
How to decide without the hype
- Write down your hard constraints: budget, school needs, maximum commute, HOA tolerance.
- Check TEA campus letters for the exact schools your address feeds—not only the district headline.
- Drive the commute twice in rush hour.
- Read the latest Gunter and Van Alstyne trackers for roads, subdivisions, and industrial updates.
- Pull fresh comps; do not shop off ACS medians alone.
Gunter and Van Alstyne are both serious answers to “where should we raise kids in Grayson County?” One leans quieter and pricier on the ACS home-value line; the other leans larger, faster, and highway-connected. The right pick is the one that matches your morning drive and your kids’ campuses—not the louder Facebook thread.
Sources: U.S. Census Bureau Population Estimates Program city totals (Vintage 2025 subcounty file for Texas); Census Reporter ACS 2024 5-year tables for income, housing, age, tenure, and poverty; Census Reporter / ACS mean travel time summaries for Gunter ISD and Van Alstyne ISD geographies; Texas Education Agency 2025 accountability district-ratings reports for Gunter ISD (091917) and Van Alstyne ISD (091908); city building-permit tallies as compiled from Census BPS in public city profiles. Always re-check TXschools.gov and current listings before you decide.